Note
Go to the end to download the full example code or to run this example in your browser via Binder.
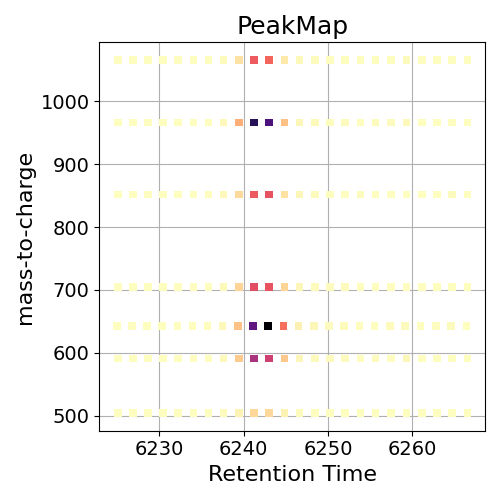
PeakMap ms_matplotlib#
This shows a peakmap across m/z and retention time. This peakmap is quite clean because signals are extracted across the m/z dimension.
<Axes: title={'center': 'PeakMap'}, xlabel='Retention Time', ylabel='mass-to-charge'>
import pandas as pd
from pyopenms_viz.util import download_file

pd.options.plotting.backend = "ms_matplotlib"

# GitHub raw URL (primary) with Zenodo as backup
url = "https://raw.githubusercontent.com/OpenMS/pyopenms_viz/main/test/test_data/ionMobilityTestFeatureDf.tsv"
backup_url = (
    "https://zenodo.org/records/17904352/files/ionMobilityTestFeatureDf.tsv?download=1"
)
local_path = "ionMobilityTestFeatureDf.tsv"
download_file(url, local_path, backup_url=backup_url)
df = pd.read_csv(local_path, sep="\t")

# Code to plot a peakmap
df.plot(kind="peakmap", x="rt", y="mz", z="int", aggregate_duplicates=True)
Total running time of the script: (0 minutes 0.195 seconds)