Note
Go to the end to download the full example code or to run this example in your browser via Binder.
Spectrum ms_matplotlib#
This example shows a spectrum. We can add the ion_annotation and sequence annotation by specifying these columns.
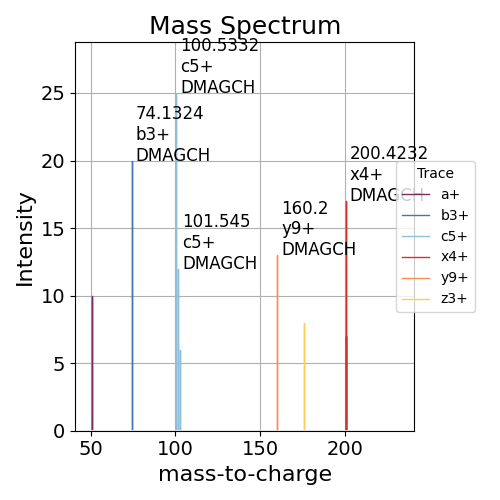
<Axes: title={'center': 'Mass Spectrum'}, xlabel='mass-to-charge', ylabel='Intensity'>
import pandas as pd
from pyopenms_viz.util import download_file

pd.options.plotting.backend = "ms_matplotlib"

# GitHub raw URL (primary) with Zenodo as backup
url = "https://raw.githubusercontent.com/OpenMS/pyopenms_viz/main/test/test_data/TestSpectrumDf.tsv"
backup_url = "https://zenodo.org/records/17904352/files/TestSpectrumDf.tsv?download=1"
local_path = "TestSpectrumDf.tsv"
download_file(url, local_path, backup_url=backup_url)
df = pd.read_csv(local_path, sep="\t")

# mirror a reference spectrum with ion and sequence annotations
df.plot(
    x="mz",
    y="intensity",
    kind="spectrum",
    ion_annotation="ion_annotation",
    sequence_annotation="sequence",
)
Total running time of the script: (0 minutes 0.157 seconds)