Note
Go to the end to download the full example code or to run this example in your browser via Binder.
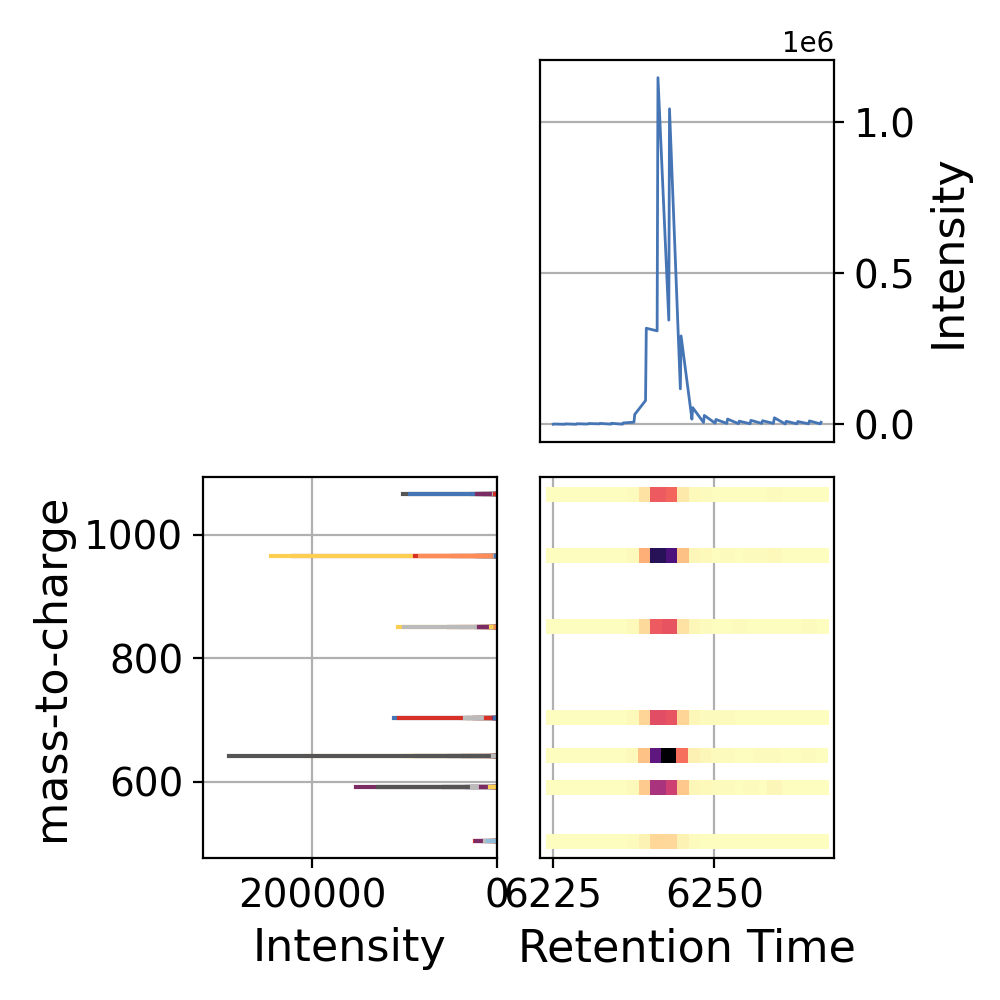
PeakMap ms_matplotlib#
This example plots a peakmap with marginals by setting add_marginals=True A chromatogram is shown along the x-axis and a spectrum is shown along the y-axis.
<Figure size 1000x1000 with 3 Axes>
import pandas as pd
from pyopenms_viz.util import download_file

pd.options.plotting.backend = "ms_matplotlib"

# GitHub raw URL (primary) with Zenodo as backup
url = "https://raw.githubusercontent.com/OpenMS/pyopenms_viz/main/test/test_data/ionMobilityTestFeatureDf.tsv"
backup_url = (
    "https://zenodo.org/records/17904352/files/ionMobilityTestFeatureDf.tsv?download=1"
)
local_path = "ionMobilityTestFeatureDf.tsv"
download_file(url, local_path, backup_url=backup_url)
df = pd.read_csv(local_path, sep="\t")

df.plot(
    kind="peakmap",
    x="rt",
    y="mz",
    z="int",
    add_marginals=True,
    aggregate_duplicates=True,
)
Total running time of the script: (0 minutes 0.416 seconds)