Note
Go to the end to download the full example code or to run this example in your browser via Binder.
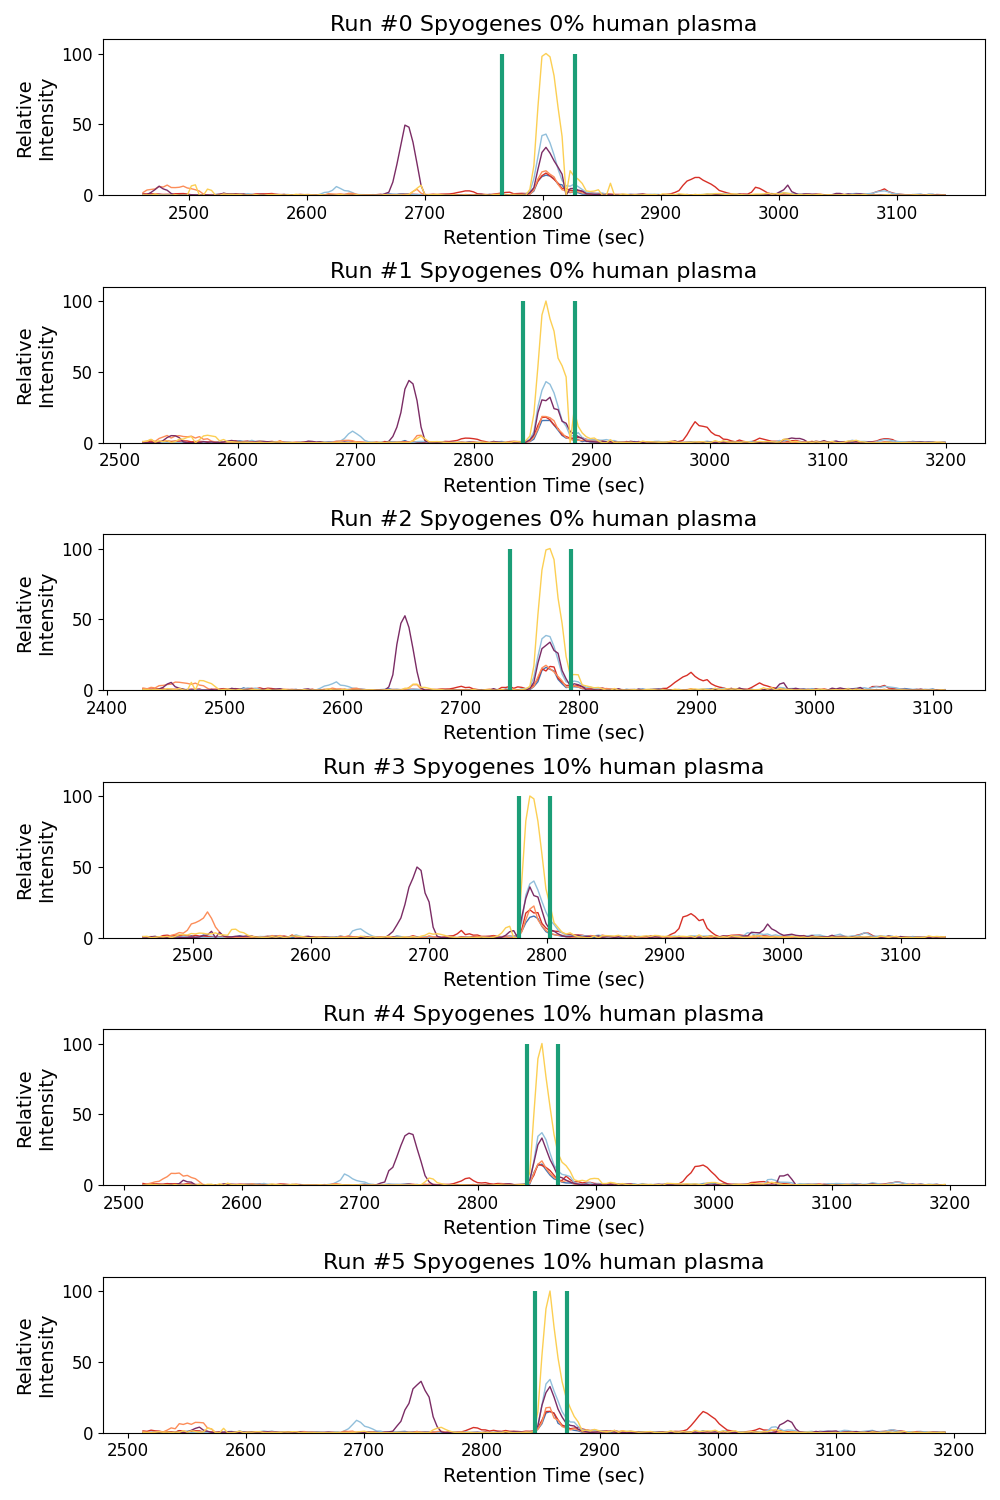
Plot Spyogenes subplots ms_matplotlib#
Here we show how we can plot multiple chromatograms across runs together
<Figure size 1000x1500 with 6 Axes>
import pandas as pd
import numpy as np
import matplotlib.pyplot as plt
from pyopenms_viz.util import download_file, unzip_file

pd.options.plotting.backend = "ms_matplotlib"

# GitHub release asset (primary) with Zenodo as backup
url = (
    "https://github.com/OpenMS/pyopenms_viz/releases/download/manuscript/spyogenes.zip"
)
backup_url = "https://zenodo.org/records/17904512/files/spyogenes.zip?download=1"
zip_filename = "spyogenes.zip"
zip_dir = "spyogenes"

download_file(url, zip_filename, backup_url=backup_url)
unzip_file(zip_filename, ".")  # Extract to current directory

chrom_df = pd.read_csv(
    "spyogenes/chroms_AADGQTVSGGSILYR3.tsv", sep="\t"
)  # contains chromatogram for precursor across all runs

annotation_bounds = pd.read_csv(
    "spyogenes/AADGQTVSGGSILYR3_manual_annotations.tsv", sep="\t"
)  # contain annotations across all runs

##### Set Plotting Variables #####
RUN_NAMES = [
    "Run #0 Spyogenes 0% human plasma",
    "Run #1 Spyogenes 0% human plasma",
    "Run #2 Spyogenes 0% human plasma",
    "Run #3 Spyogenes 10% human plasma",
    "Run #4 Spyogenes 10% human plasma",
    "Run #5 Spyogenes 10% human plasma",
]

fig, axs = plt.subplots(len(np.unique(chrom_df["run"])), 1, figsize=(10, 15))

# plt.close ### required for running in jupyter notebook setting

# For each run fill in the axs object with the corresponding chromatogram
plot_list = []
for i, run in enumerate(RUN_NAMES):
    run_df = chrom_df[chrom_df["run_name"] == run]
    current_bounds = annotation_bounds[annotation_bounds["run"] == run]

    run_df.plot(
        kind="chromatogram",
        x="rt",
        y="int",
        grid=False,
        by="ion_annotation",
        title=run_df.iloc[0]["run_name"],
        title_font_size=16,
        xaxis_label_font_size=14,
        yaxis_label_font_size=14,
        xaxis_tick_font_size=12,
        yaxis_tick_font_size=12,
        canvas=axs[i],
        relative_intensity=True,
        annotation_data=current_bounds,
        xlabel="Retention Time (sec)",
        ylabel="Relative\nIntensity",
        annotation_legend_config=dict(show=False),
        legend_config={"show": False},
    )

fig.tight_layout()
fig
Total running time of the script: (0 minutes 1.233 seconds)