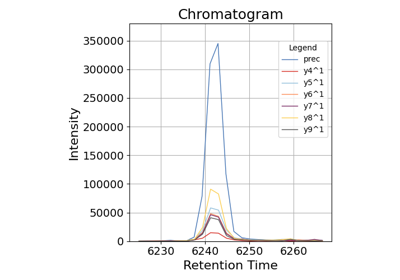
Chromatogram#
Chromatograms can be plotted using kind = chromatogram. In this plot, retention time is on the x-axis and intensity is on the y-axis. The by parameter can be used to separate out different mass traces.
Parameters#
Parameter |
Type |
Description |
Default |
|---|---|---|---|
x* |
str |
The column name for the X-axis data. Required. |
|
y* |
str |
The column name for the Y-axis data. Required. |
|
by* |
str |
The column name for the grouping variable. |
|
canvas* |
Any |
Canvas for the plot. For Bokeh, this is a bokeh.plotting.Figure object. For Matplotlib, this is an Axes object, and for Plotly, this is a plotly.graph_objects.Figure object. If none, axis will be created Defaults to None. |
|
show_plot |
bool |
Whether to display the plot. Defaults to True. |
True |
line_width |
float |
Width of the line. Defaults to 1. |
1 |
line_type |
str |
Type of the line (e.g., “solid”, “dashed”). Defaults to “solid”. |
“solid” |
annotation_data |
pd.DataFrame | None |
Data for annotations. Defaults to None. |
None |
annotation_colormap |
str |
Colormap for annotations. Defaults to “Dark2”. |
“Dark2” |
annotation_line_width |
float |
Width of the annotation lines. Defaults to 3. |
3 |
annotation_line_type |
str |
Type of the annotation lines (e.g., “solid”, “dashed”). Defaults to “solid”. |
“solid” |
annotation_legend_config |
Dict | LegendConfig |
Configuration for the annotation legend. Defaults to a LegendConfig instance with title “Features”. |
a LegendConfig instance with title “Features” |
xlabel |
str |
Label for the X-axis. Defaults to “Retention Time”. |
“Retention Time” |
ylabel |
str |
Label for the Y-axis. Defaults to “Intensity”. |
“Intensity” |
title |
str |
Title of the plot. Defaults to “Chromatogram”. |
“Chromatogram” |