Peak Map#
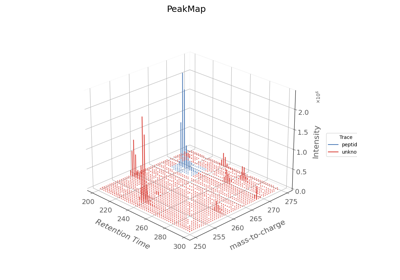
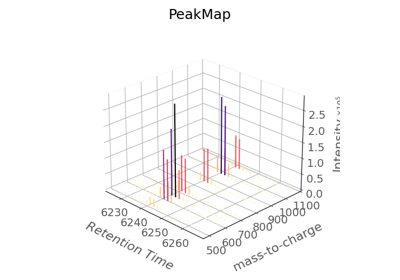
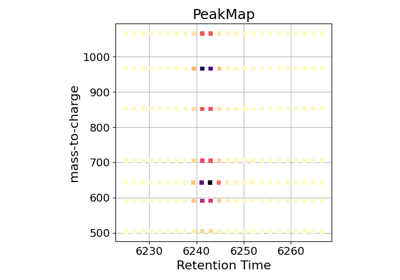
Peak Maps can be plotted using kind = peakmap. Commonly in this plot, mass-to-charge is on the x-axis, retention time is on the y-axis and intensity is on the z-axis (or represented by color). The x and y axis can be changed based on use case, for example y can also be ion mobility. Using plot_3d=True enables 3D plotting. Currently 3D plotting only supported for ms_matplotlib and ms_plotly backends.
Note: y_kind / x_kind is only relevant if add_marginals is set to True.
Parameters#
Parameter |
Type |
Description |
Default |
|---|---|---|---|
x* |
str |
The column name for the X-axis data. Required. |
|
y* |
str |
The column name for the Y-axis data. Required. |
|
by* |
str |
The column name for the grouping variable. |
|
canvas* |
Any |
Canvas for the plot. For Bokeh, this is a bokeh.plotting.Figure object. For Matplotlib, this is an Axes object, and for Plotly, this is a plotly.graph_objects.Figure object. If none, axis will be created Defaults to None. |
|
show_plot |
bool |
Whether to display the plot. Defaults to True. |
True |
bin_peaks |
Union[Literal[“auto”], bool] |
Whether to bin peaks. Defaults to “auto”, can also be set to True or False. |
“auto”, can also be set to True or False |
num_x_bins |
int |
Number of bins along the X-axis. Defaults to 50. Ignored if bin_peaks is False or “auto”. |
50. Ignored if bin_peaks is False or “auto” |
num_y_bins |
int |
Number of bins along the Y-axis. Defaults to 50. Ignored if bin_peaks is False or “auto”. |
50. Ignored if bin_peaks is False or “auto” |
z_log_scale |
bool |
Whether to use logarithmic scale for Z-axis. Defaults to False. |
False |
fill_by_z |
bool |
Whether to fill markers by Z value. Defaults to True. |
True |
marker_size |
int |
Size of the markers. Defaults to 30. |
30 |
marker |
Iterator[str] | MarkerShapeGenerator |
Marker shapes. Defaults to a MarkerShapeGenerator instance. |
a MarkerShapeGenerator instance |
add_marginals |
bool |
Whether to add marginal plots. Defaults to False. |
False |
y_kind |
str |
Type of plot for the Y-axis marginal. Defaults to “spectrum”. |
“spectrum” |
x_kind |
str |
Type of plot for the X-axis marginal. Defaults to “chromatogram”. |
“chromatogram” |
aggregation_method |
Literal[“mean”, “sum”, “max”] |
Method for aggregating data. Defaults to “mean”. |
“mean” |
annotation_data |
pd.DataFrame | None |
Data for annotations. Defaults to None. |
None |
annotation_colormap |
str |
Colormap for annotations. Defaults to “Dark2”. |
“Dark2” |
annotation_line_width |
float |
Width of the annotation lines. Defaults to 3. |
3 |
annotation_line_type |
str |
Type of the annotation lines (e.g., “solid”, “dashed”). Defaults to “solid”. |
“solid” |
annotation_legend_config |
Dict | LegendConfig |
Configuration for the annotation legend. Defaults to a LegendConfig instance with title “Features”. |
a LegendConfig instance with title “Features” |
xlabel |
str |
Label for the X-axis. Defaults to “Retention Time”. |
“Retention Time” |
ylabel |
str |
Label for the Y-axis. Defaults to “mass-to-charge”. |
“mass-to-charge” |
zlabel |
str |
Label for the Z-axis. Defaults to “Intensity”. |
“Intensity” |
title |
str |
Title of the plot. Defaults to “PeakMap”. |
“PeakMap” |
x_plot_config |
ChromatogramConfig | SpectrumConfig |
Configuration for the X-axis marginal plot. Defaults to (set internally). |
(set internally) |
y_plot_config |
ChromatogramConfig | SpectrumConfig |
Configuration for the Y-axis marginal plot. Defaults to (set internally). |
(set internally) |