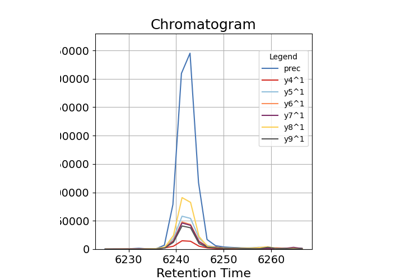
Chromatogram#
Chromatograms can be plotted using kind = chromatogram. In this plot, retention time is on the x-axis and intensity is on the y-axis. The by parameter can be used to separate out different mass traces.
Parameters#
Parameter |
Default |
Type |
Description |
|---|---|---|---|
x* |
str |
The column name for x-axis data |
|
y* |
str |
The column name for y-axis data |
|
by |
str |
The column name to group by. Will result in separate line traces per group |
|
backend |
str |
‘Backend to use. One of: [ “ms_matplotlib”, “ms_bokeh”, “ms_plotly” ]. Must be specified if not set globally |
|
annotation_data |
DataFrame |
DataFrame of annotation data with columns [‘leftWidth’, ‘rightWidth’] |
|
relative_intensity |
False |
bool |
Convert y-axis values to relative intensity |
height |
int |
Height of plot, units dependent on backend. |
|
width |
int |
Width of plot in pixels, units dependent on backend. |
|
grid |
False |
bool |
Whether to show grid on the plot |
toolbar_location |
“above” |
Location of toolbar for interactive plots. One of: [“above”, “below”, “left”] |
|
fig |
None |
fig |
Existing figure object to plot on. Useful for matplotlib backend |
xlabel |
None |
str |
Label for x axis |
ylabel |
None |
str |
Label for y axis |
show_plot |
True |
bool |
Whether to display the plot. If plot is not shown, will return the plot object corresponding with the backend. If plot is displayed the method returns None |