Plot Gallery#
Pyopenms-viz plotting occurs by calling the .plot() method on a pandas dataframe. Mandatory Types include has several built in plots which can be set using the “kind” attribute
BOKEH Plots#
These examples are generated if backend=’ms_bokheh’. Interactive plots are supported and rendering is typically faster than the PLOTLY backend.


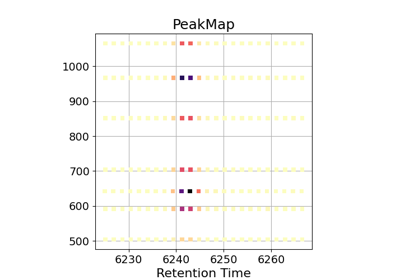
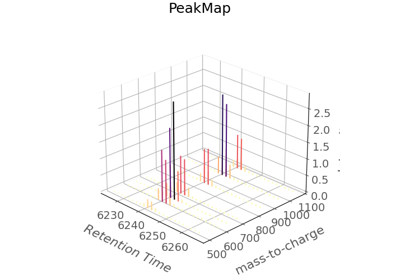
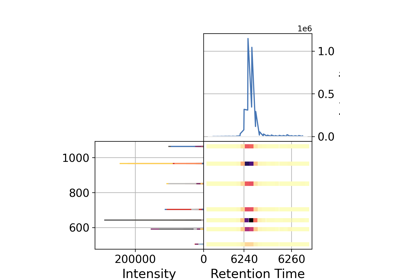
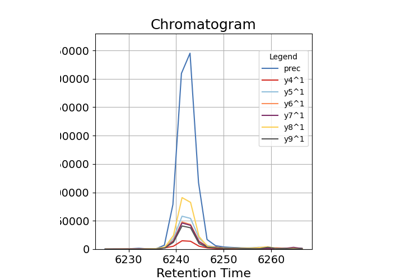
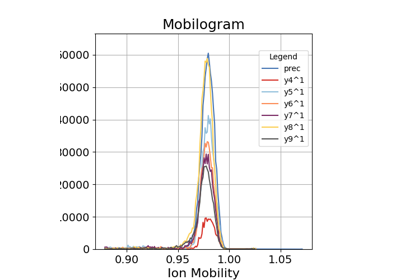
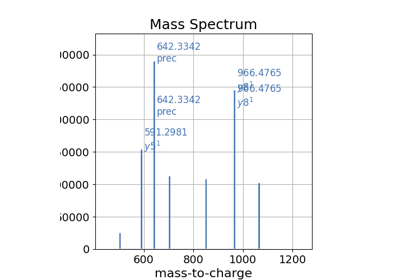
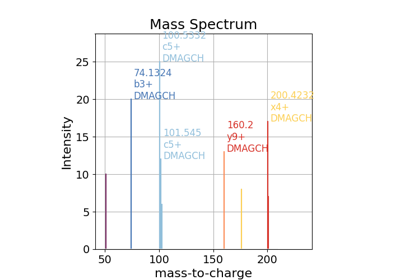
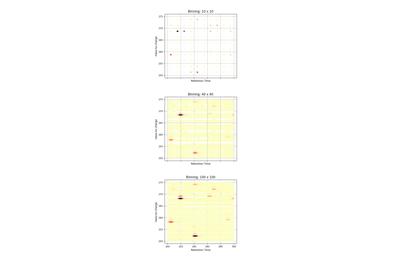
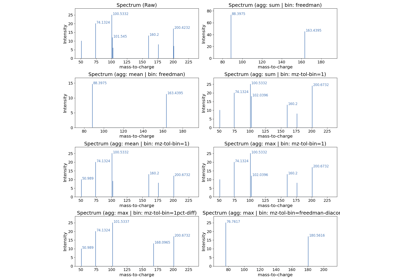
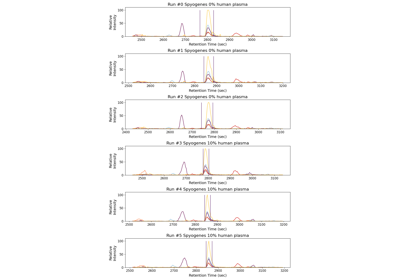
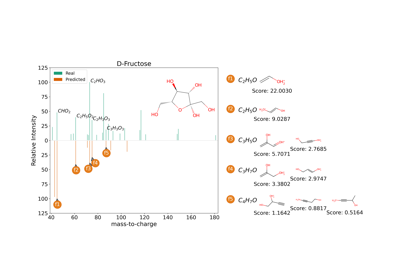
MATPLOTLIB Plots#
These plots can be generated by setting the backend=’ms_matplotlib’. Matplotlib is useful for generating static publication quality plots.
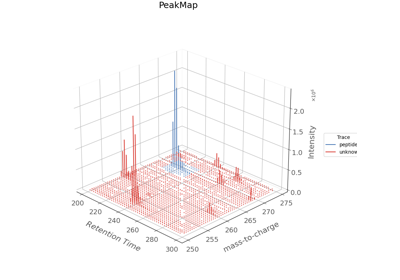
PLOTLY Plots#
These plots can be generated by setting the backend=’ms_plotly’. PLOTLY plots inferfances well with StreamLit WebApps and allow for interactive 3D plots. Rendering is typically slower than the BOKEH backend.


