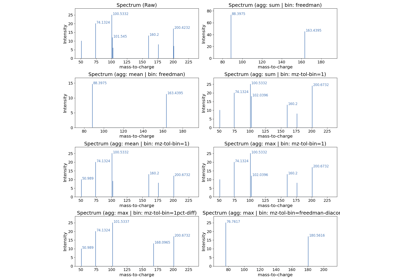
Spectrum#
A spectrum can be plot using kind = “spectrum”. In this plot, mass-to-charge ratio is on the x-axis and intensity is on the y-axis.
Parameters#
Parameter |
Default |
Type |
Description |
|---|---|---|---|
x* |
str |
The column name for x-axis data |
|
y* |
str |
The column name for y-axis data |
|
by |
str |
The column name to group by |
|
backend |
str |
‘Backend to use. One of: [ “ms_matplotlib”, “ms_bokeh”, “ms_plotly” ]. Must be specified if not set globally |
|
reference_spectrum |
DataFrame |
alternative dataframe to plot as the reference spectrum. |
|
mirror_spectrum |
False |
bool |
Whether to plot a mirror spectrum |
relative_intensity |
False |
bool |
Convert y-axis values to relative intensity |
height |
int |
Height of plot, units dependent on backend. |
|
width |
int |
Width of plot in pixels, units dependent on backend. |
|
grid |
False |
bool |
Whether to show grid on the plot |
toolbar_location |
“above” |
Location of toolbar for interactive plots. One of: [“above”, “below”, “left”] |
|
fig |
None |
fig |
Existing Figure object to plot on |
xlabel |
None |
str |
Label for x axis |
ylabel |
None |
str |
Label for y axis |
show_plot |
True |
bool |
Whether to display the plot. If plot is not shown, will return the plot object corresponding with the backend. If plot is displayed the method returns None |
bin_peaks |
False |
bool | “auto” |
If True, will bin peaks based on specified number of bins in num_x_bins. If “auto”, will automatically determine the number of bins based on the data using the strategy specified in bin_method. |
bin_method |
“mz-tol-bin” |
Binning method, one of [ “none”, “sturges”, “freedman-diaconis”, “mz-tol-bin”] |
|
num_x_bins |
50 |
int |
Number of bins, will be adjusted if bin_peaks is “auto” |
aggregation_method |
“mean |
How to aggregate duplicate dataframe entries, one of [ “mean”, “sum”, “max” ] |
|
mz_tol |
“1pct-diff” |
mass-to-charge tolerance for “mz_tol_bin” bin_method. Can be one of [float, ‘freedman-diaconis’, ‘1pct-diff’] |
|
peak_color |
None |
None | str |
Peak color for the plot. If not specified will be automatically generated. Overridden by annotation_color. E.g. if a color is specified in the annotation_color column than this will be overridden. |
annotate_top_n_peaks |
5 |
int |
Number of peaks to annotate |
annotate_mz |
True |
bool |
whether to annotate the top n peaks with their mz values |
sequence_annotation |
str |
column containing sequence_annotation information. |
|
custom_annotation |
str |
column containing custom annotation |
|
annotation_color |
str |
column containing the annotation color. If not specified will be automatically generated |