Peak Map#
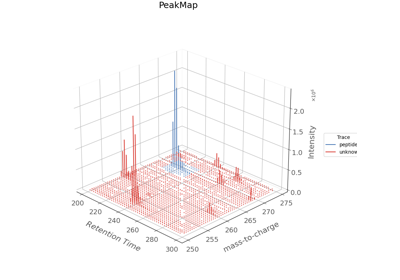
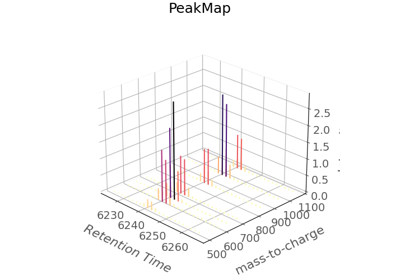
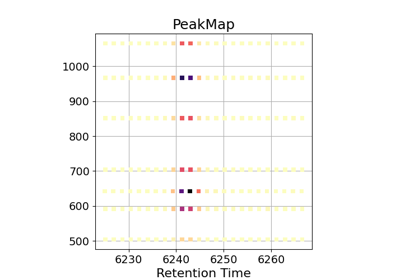
Peak Maps can be plotted using kind = peakmap. Commonly in this plot, mass-to-charge is on the x-axis, retention time is on the y-axis and intensity is on the z-axis (or represented by color). The x and y axis can be changed based on use case, for example y can also be ion mobility. Using plot_3d=True enables 3D plotting. Currently 3D plotting only supported for ms_matplotlib and ms_plotly backends.
Note: y_kind / x_kind is only relevant if add_marginals is set to True.
Parameters#
Parameter |
Default |
Type |
Description |
|---|---|---|---|
x* |
str |
The column name for x-axis data |
|
y* |
str |
The column name for y-axis data |
|
z* |
str |
The column name for z-axis data |
|
backend |
Literal[“ms_matplotlib”, “ms_bokeh”, “ms_plotly”] |
‘Backend to use. Must be specified if not set globally |
|
by |
str |
The column name to group by |
|
add_marginals |
False |
bool |
Whether to add marginal plots, ( x vs z and y vs z plots) |
x_kind |
chromatogram |
str |
Marginal plot for x-axis [Note: x_kind is only relevant if add_marginals is True] |
y_kind |
spectrum |
str |
Marginal plot for y-axis [Note: y_kind is only relevant if add_marginals is True] |
relative_intensity |
False |
bool |
Convert y-axis values to relative intensity |
height |
int |
Height of plot, units dependent on backend. |
|
width |
int |
Width of plot in pixels, units dependent on backend. |
|
grid |
False |
bool |
Whether to show grid on the plot |
toolbar_location |
“above” |
Location of toolbar for interactive plots. One of: [“above”, “below”, “left”] |
|
fig |
None |
fig |
Existing Figure object to plot on. Useful for matplotlib backend where need to specify the figure object before plotting. If not supplied will create a figure object |
xlabel |
“” |
str |
Label for x axis |
ylabel |
“” |
str |
Label for y axis |
zlabel |
‘’ |
str |
Label for z-axis |
show_plot |
True |
bool |
Whether to display the plot. If plot is not shown, will return the plot object corresponding with the backend. If plot is displayed the method returns None |
bin_peaks |
auto |
bool | “auto” |
If True, will bin peaks based on specified number of bins in num_x_bins. If “auto”, will automatically determine the number of bins based on the data using the strategy specified in bin_method. |
aggregation_method |
“mean” |
Literal[“mean”, “sum”, “max”] |
How to aggregate duplicate entries |
num_x_bins |
50 |
int |
Number of x-bins in heatmap |
num_y_bins |
50 |
int |
Number of y-bins in heatmap |
z_log_scale |
False |
bool |
Whether to log-transform z-axis |
fill_by_z |
True |
bool |
Whether heatmap coloring should be based on z-axis values |