Note
Go to the end to download the full example code. or to run this example in your browser via Binder
PeakMap ms_matplotlib#
This shows a peakmap across m/z and retention time. This peakmap is quite clean because signals are extracted across the m/z dimension.
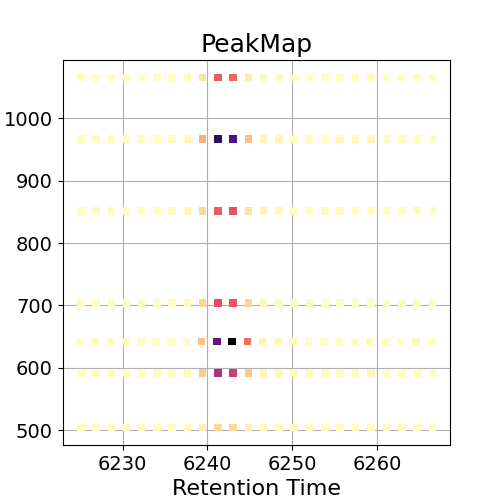
<Axes: title={'center': 'PeakMap'}, xlabel='Retention Time', ylabel='mass-to-charge'>
import pandas as pd
from io import StringIO
import requests

pd.options.plotting.backend = "ms_matplotlib"

# download the file for example plotting
url = "https://github.com/OpenMS/pyopenms_viz/releases/download/v0.1.5/ionMobilityTestFeatureDf.tsv"
response = requests.get(url)
response.raise_for_status()  # Check for any HTTP errors
df = pd.read_csv(StringIO(response.text), sep="\t")

# Code to plot a peakmap
df.plot(kind="peakmap", x="rt", y="mz", z="int", aggregate_duplicates=True)
Total running time of the script: (0 minutes 0.156 seconds)