Note
Go to the end to download the full example code. or to run this example in your browser via Binder
Spectrum of Extracted DIA Data ms_matplotlib#
This example shows a spectrum from extracted data. No binning is applied.
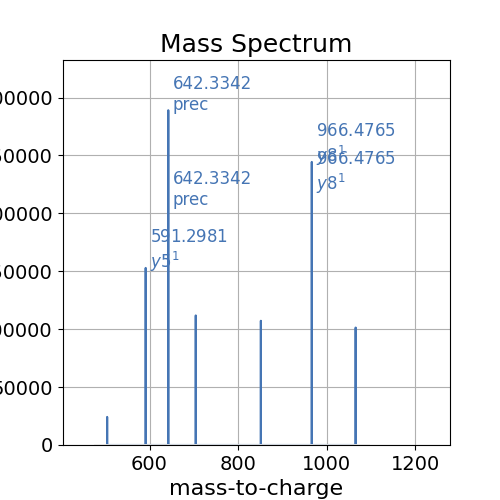
<Axes: title={'center': 'Mass Spectrum'}, xlabel='mass-to-charge', ylabel='Intensity'>
import pandas as pd
import requests
from io import StringIO

pd.options.plotting.backend = "ms_matplotlib"

# download the file for example plotting
url = "https://github.com/OpenMS/pyopenms_viz/releases/download/v0.1.5/ionMobilityTestFeatureDf.tsv"
response = requests.get(url)
response.raise_for_status()  # Check for any HTTP errors
df = pd.read_csv(StringIO(response.text), sep="\t")

df.plot(
    kind="spectrum",
    x="mz",
    y="int",
    custom_annotation="Annotation",
    annotate_mz=True,
    bin_method="none",
    annotate_top_n_peaks=5,
    aggregate_duplicates=True,
)
Total running time of the script: (0 minutes 0.340 seconds)