Note
Go to the end to download the full example code. or to run this example in your browser via Binder
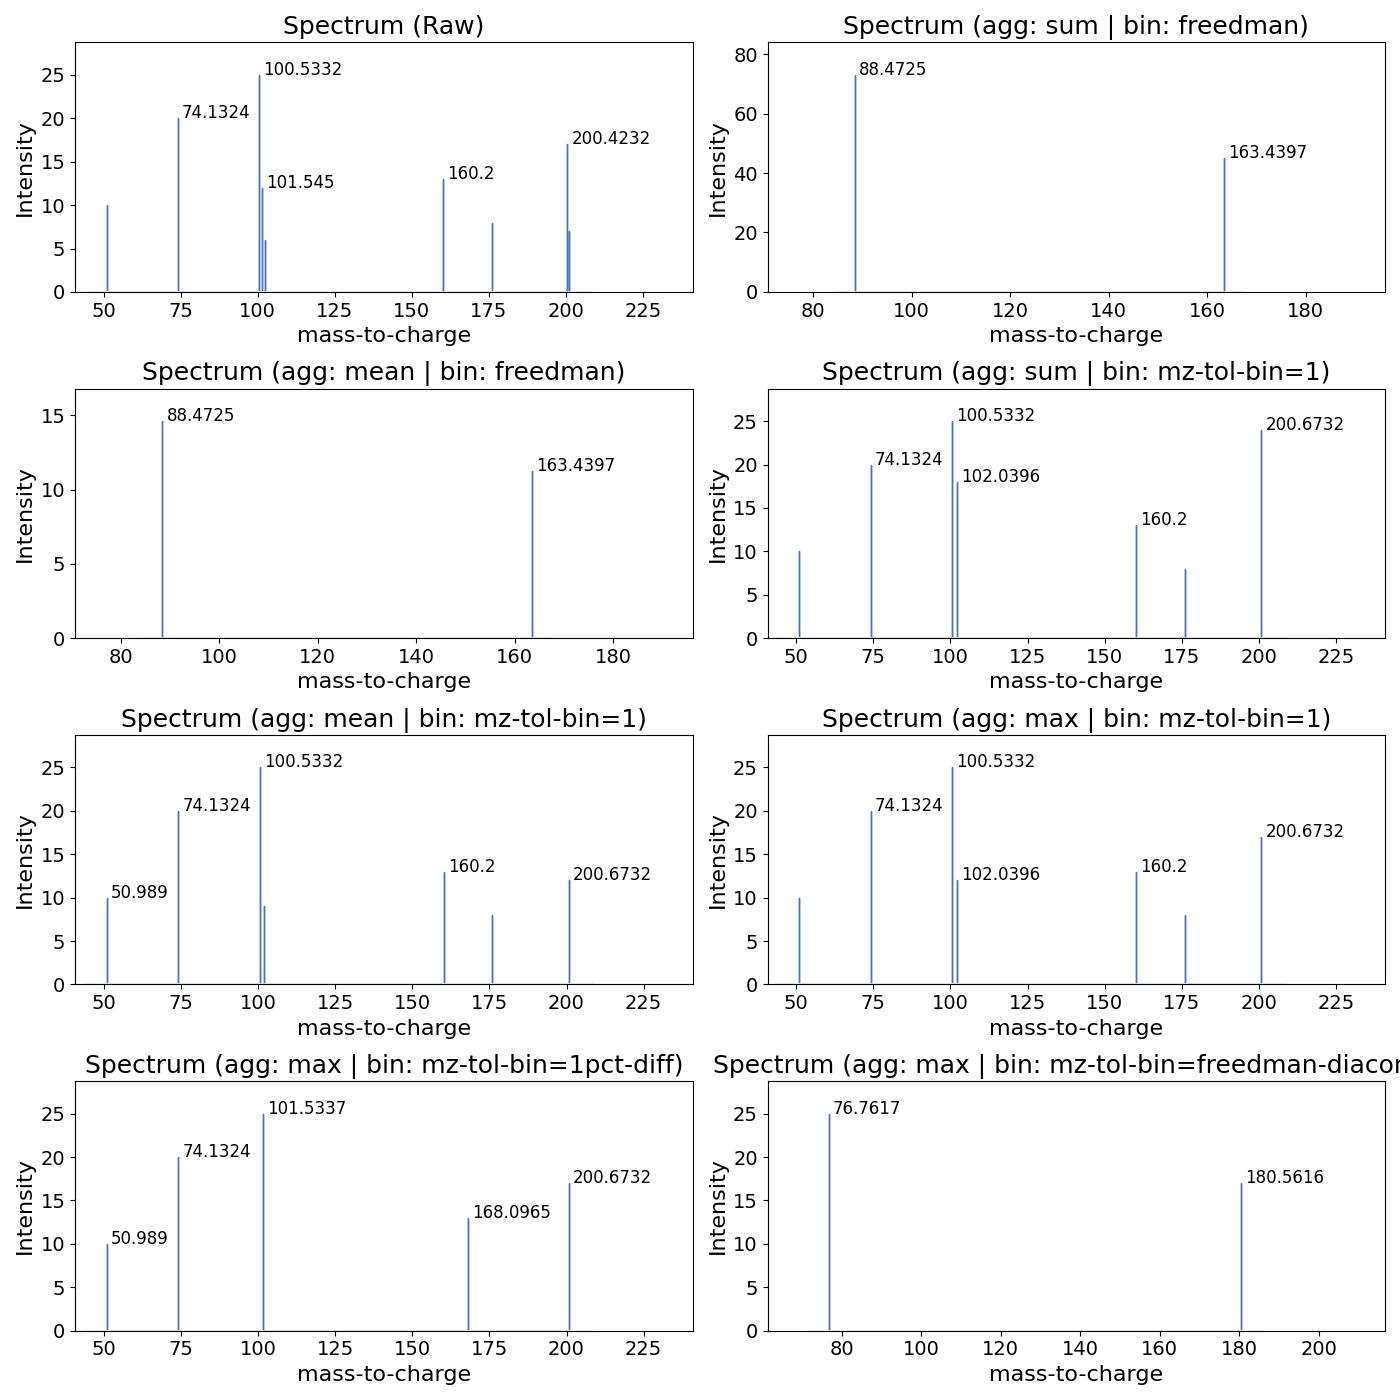
Investigate Spctrum Binning ms_matplotlib#
Here we use a dummy spectrum example to investigate spectrum binning.
import pandas as pd
import matplotlib.pyplot as plt
import requests
from io import StringIO

pd.options.plotting.backend = "ms_matplotlib"

# download the file for example plotting
url = (
    "https://github.com/OpenMS/pyopenms_viz/releases/download/v0.1.5/TestSpectrumDf.tsv"
)
response = requests.get(url)
response.raise_for_status()  # Check for any HTTP errors
df = pd.read_csv(StringIO(response.text), sep="\t")

# Let's assess the peak binning and create a 4 by 2 subplot to visualize the different methods of binning
params_list = [
    {"title": "Spectrum (Raw)", "bin_peaks": False},
    {
        "title": "Spectrum (agg: sum | bin: freedman)",
        "bin_peaks": "auto",
        "bin_method": "freedman-diaconis",
        "aggregation_method": "sum",
    },
    {
        "title": "Spectrum (agg: mean | bin: freedman)",
        "bin_peaks": "auto",
        "bin_method": "freedman-diaconis",
        "aggregation_method": "mean",
    },
    {
        "title": "Spectrum (agg: sum | bin: mz-tol-bin=1)",
        "bin_peaks": "auto",
        "bin_method": "mz-tol-bin",
        "mz_tol": 1,
        "aggregation_method": "sum",
    },
    {
        "title": "Spectrum (agg: mean | bin: mz-tol-bin=1)",
        "bin_peaks": "auto",
        "bin_method": "mz-tol-bin",
        "mz_tol": 1,
        "aggregation_method": "mean",
    },
    {
        "title": "Spectrum (agg: max | bin: mz-tol-bin=1)",
        "bin_peaks": "auto",
        "bin_method": "mz-tol-bin",
        "mz_tol": 1,
        "aggregation_method": "max",
    },
    {
        "title": "Spectrum (agg: max | bin: mz-tol-bin=1pct-diff)",
        "bin_peaks": "auto",
        "bin_method": "mz-tol-bin",
        "mz_tol": "1pct-diff",
        "aggregation_method": "max",
    },
    {
        "title": "Spectrum (agg: max | bin: mz-tol-bin=freedman-diaconis)",
        "bin_peaks": "auto",
        "bin_method": "mz-tol-bin",
        "mz_tol": "freedman-diaconis",
        "aggregation_method": "max",
    },
]

# Create a 3-row subplot
fig, axs = plt.subplots(4, 2, figsize=(14, 14))

i = j = 0
for params in params_list:
    p = df.plot(
        kind="spectrum", x="mz", y="intensity", canvas=axs[i][j], grid=False, show_plot=False, **params
    )
    j += 1
    if j >= 2:  # If we've filled two columns, move to the next row
        j = 0
        i += 1

fig.tight_layout()
plt.show()
Total running time of the script: (0 minutes 0.789 seconds)