Note
Go to the end to download the full example code. or to run this example in your browser via Binder
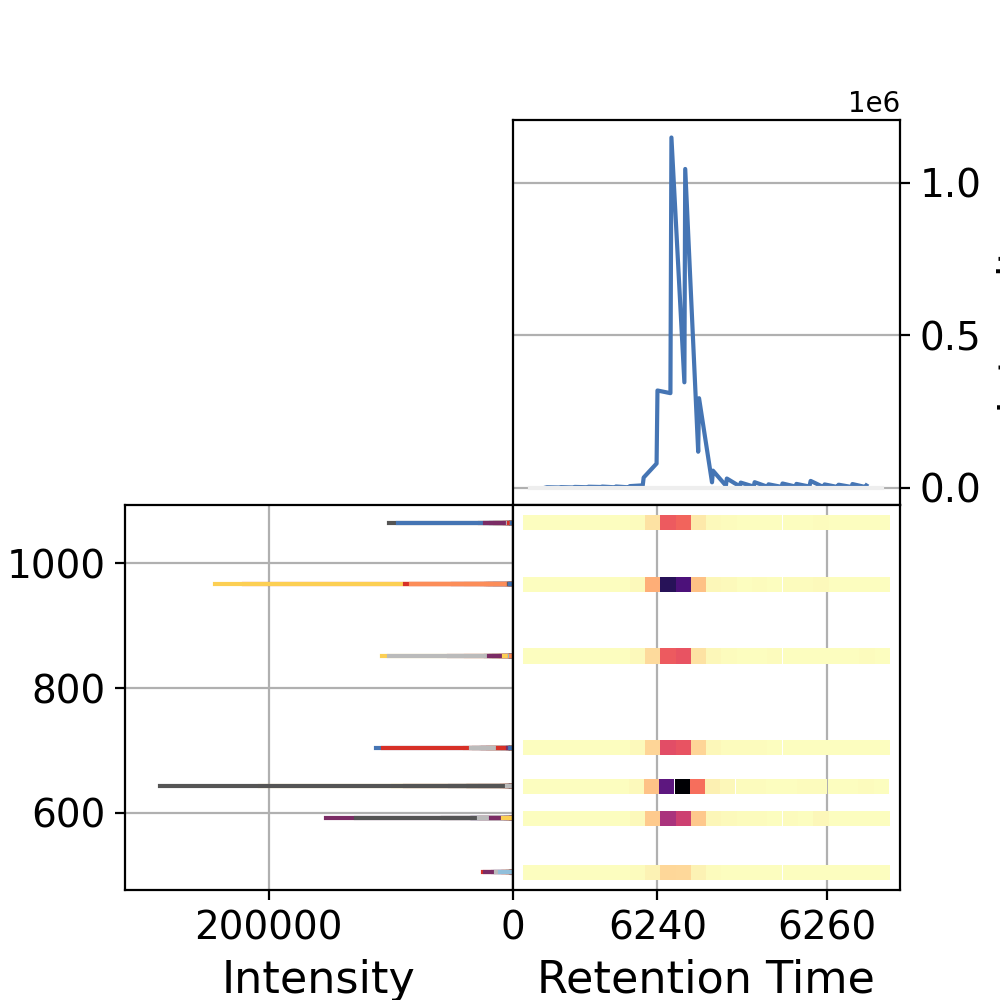
PeakMap ms_matplotlib#
This example plots a peakmap with marginals by setting add_marginals=True A chromatogram is shown along the x-axis and a spectrum is shown along the y-axis.
<Figure size 1000x1000 with 3 Axes>
import pandas as pd
import requests
from io import StringIO

pd.options.plotting.backend = "ms_matplotlib"

# download the file for example plotting
url = "https://github.com/OpenMS/pyopenms_viz/releases/download/v0.1.5/ionMobilityTestFeatureDf.tsv"
response = requests.get(url)
response.raise_for_status()  # Check for any HTTP errors
df = pd.read_csv(StringIO(response.text), sep="\t")

df.plot(
    kind="peakmap",
    x="rt",
    y="mz",
    z="int",
    add_marginals=True,
    aggregate_duplicates=True,
)
Total running time of the script: (0 minutes 0.481 seconds)