Note
Go to the end to download the full example code. or to run this example in your browser via Binder
Mobilogram ms_matplotlib#
This example makes a simple plot This example shows how to use different approaches.
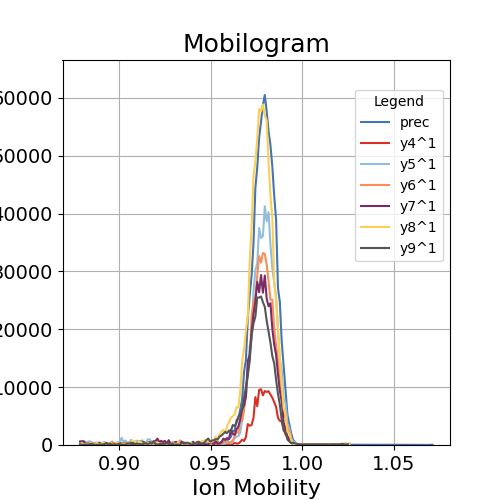
<Axes: title={'center': 'Mobilogram'}, xlabel='Ion Mobility', ylabel='Intensity'>
import pandas as pd
import requests
from io import StringIO

pd.options.plotting.backend = "ms_matplotlib"

# download the file for example plotting
url = "https://github.com/OpenMS/pyopenms_viz/releases/download/v0.1.5/ionMobilityTestFeatureDf.tsv"
response = requests.get(url)
response.raise_for_status()  # Check for any HTTP errors
df = pd.read_csv(StringIO(response.text), sep="\t")

df.plot(
    kind="mobilogram",
    x="im",
    y="int",
    by="Annotation",
    aggregate_duplicates=True,
    legend_config=dict(bbox_to_anchor=(1, 0.7)),
)
Total running time of the script: (0 minutes 0.187 seconds)